Reflex: Turning dead‑end feedback into owned, routed tickets
Hospitals were already collecting patient feedback. Reflex is what makes it matter, turning every negative response into an owned, routed, resolved ticket.
Impact
Reflex shipped and is now in daily use across 139 hospitals and clinics. The numbers below are from the live platform since launch, not projections. The short version: feedback that used to die in a monthly report now becomes owned, routed work, and the operation got measurably faster at closing the loop.
From weeks to about a day
The clearest sign the workflow holds up: as teams adopted the routing, SLAs and escalation, the time to close a complaint collapsed. A ticket that took months in the first weeks is now closed in about a day.
Recommendation scores moved the same way while Reflex was live. On the maternity chain, where response volume was high enough to trend reliably, the recommend score (NPS) climbed from about +3 to +29 over its first eight months. On the fertility chain, 77% of patients rate their overall experience "Excellent".
The qualitative shift is the bigger story:
- Leadership moved from monthly reporting to daily decision-making, because the data finally became trustworthy and actionable.
- Negative feedback stopped dying in reports and started becoming owned, tracked work.
- Every hospital unit gained clear accountability.
- RCA and CAPA turned one-off fixes into institutional memory: more than 19,000 tickets have been closed with a structured outcome, root-cause and preventive-action record.
Context
Large hospital groups increasingly compete on patient experience, not just clinical outcomes. A poor billing interaction or a slow nurse response can cost a repeat visit, a referral, and a review. So the client did the sensible thing: they collected feedback from every patient.
The tool in place: EasyRewards
The team ran on EasyRewards, their survey platform. Here's the life of one complaint in it:
The feedback was collected, then went nowhere. That gap is what the brief missed.
Reframing the brief
The brief I was handed was "redesign the interface." Very early, I pushed back on that framing. The interface was a symptom. The real problem was that feedback was a dead end: a patient could say exactly what went wrong, and that signal would land in a report nobody acted on until the end of the month.
So I reframed the goal: from redesign the dashboard to redesign the feedback operation, from the moment a patient responds to the moment the hospital has learned something.
Discovery
I walked the workflow with the people who lived in it: coordinators who triaged complaints, the heads who owned resolution, and leadership who reviewed the numbers. Four findings shaped everything:
Leadership didn't trust the data. Slow, lagging dashboards turned feedback into a monthly summary.
In the product A live dashboard fast enough to open every morning.
Feedback, but no insight. No way to see which department, doctor or journey was slipping.
In the product Scores broken down by department, doctor, zone, and OP vs IP.
Negative feedback never became action. Tickets assigned by hand, owners unclear.
In the product Every negative response files an owned ticket on its own.
"Resolved" meant nothing. No record of why it happened, so it happened again.
In the product Closing a ticket requires an outcome, a root cause and a fix.
The insight that reorganised the product
The single discovery that restructured the whole product came from watching operations, not from survey data:
Outpatient (OP) and Inpatient (IP) are not one workflow. They are two fundamentally different patient journeys.
Outpatient (OP): one visit, one ask.
Inpatient (IP): an admission, asked along the way.
The old platform flattened both into one survey and one report, which is why the data lacked context. Reflex models two journeys, not one, and that became the backbone of its information architecture.
Constraints
Designing this well meant designing within the realities of a hospital enterprise, not around them.
WhatsApp is the patient channel. But silence could mean an unhappy patient, or a message that never arrived.
So the design had to Tell delivery apart from satisfaction.
Multi-tenant by default. One platform, many hospitals.
So the design had to Make the hospital you're in unmistakable, before anything else.
The org chart is the data model. Hospitals think in units, doctors, zones and heads.
So the design had to Map every metric and ticket to that structure.
Three very different users. Leadership, experience teams, frontline resolvers.
So the design had to Give each of them their own screen, not one for all.
A design system built for a different job. My own system had no ownership, SLA or escalation states.
So the design had to Extend it with those states, on the same colour, type and components.
Design principles
Before touching layouts, I wrote down the principles I'd make every decision by. Each one shows up somewhere specific below:
Designing the solution
Rather than starting from features, I started from the three questions the operation needed answered every day, and built a dedicated screen to answer each one:
| Screen | The one question it answers | What's on it |
|---|---|---|
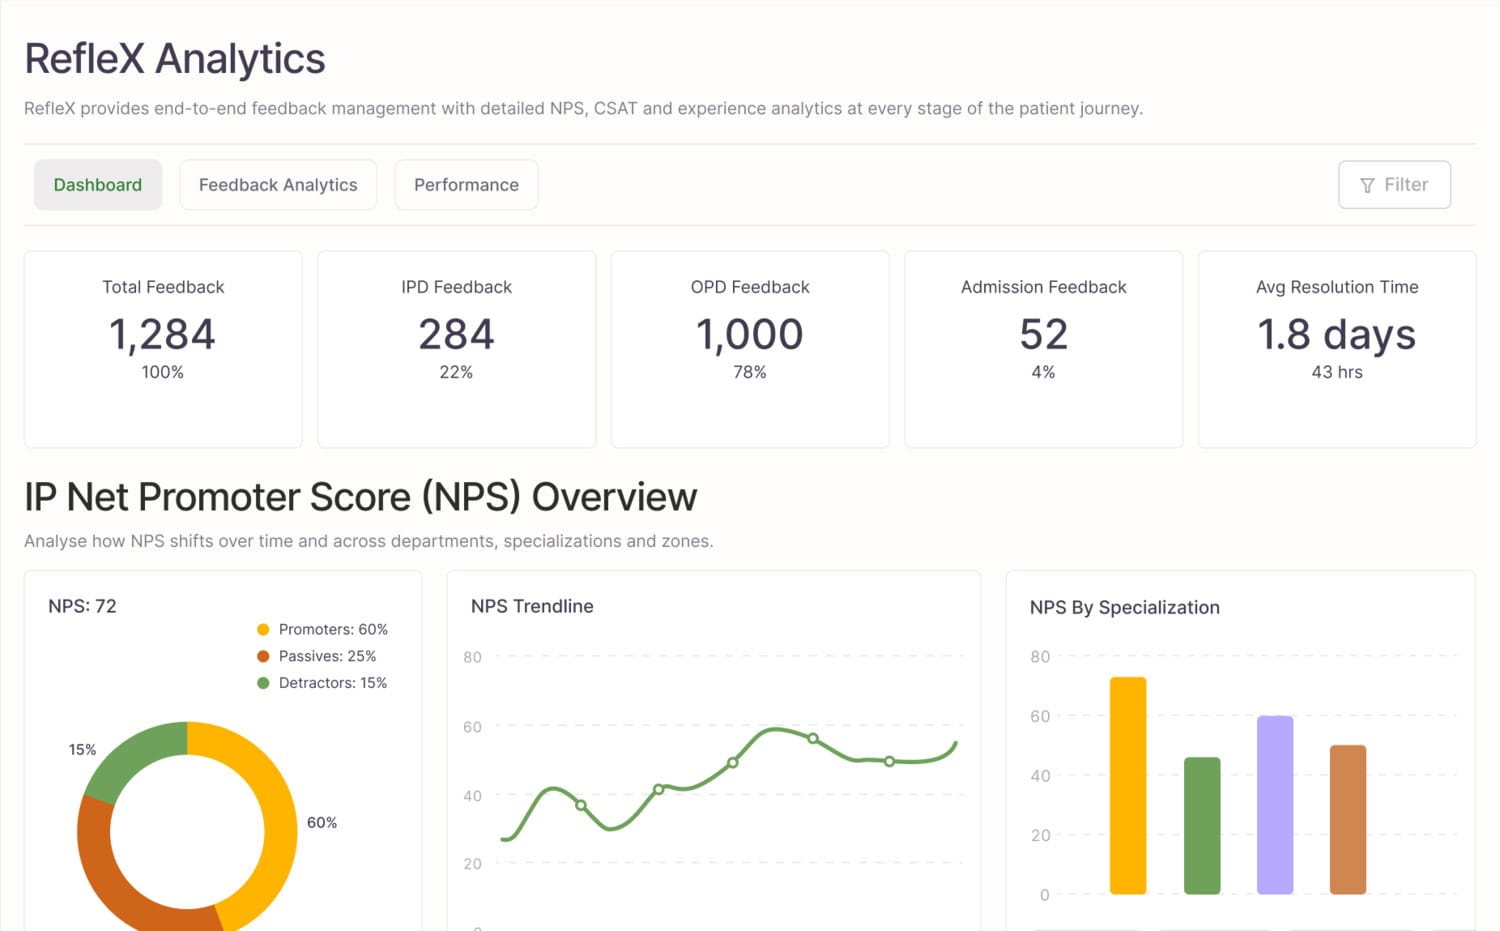
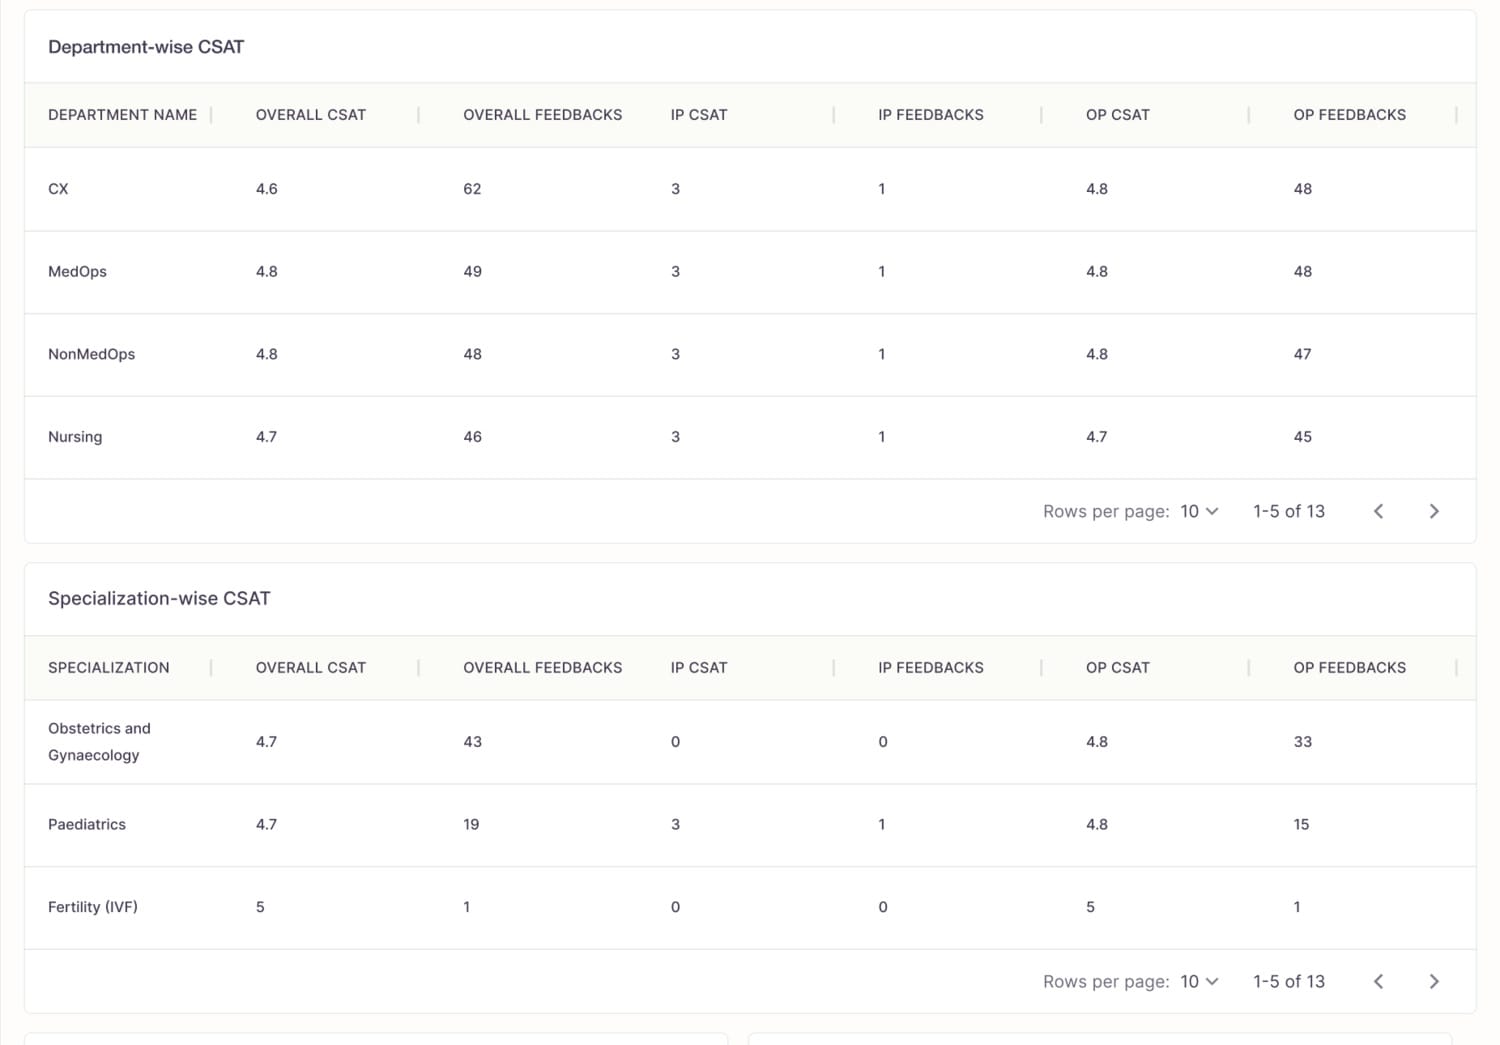
| Experience dashboard | "How is patient experience doing, and where is it slipping?" | NPS and CSAT, broken down by department, specialization, doctor and zone |
| Message & Response Tracker | "Did our surveys actually reach patients and get answered?" | sent → delivered → responded counts, and response time |
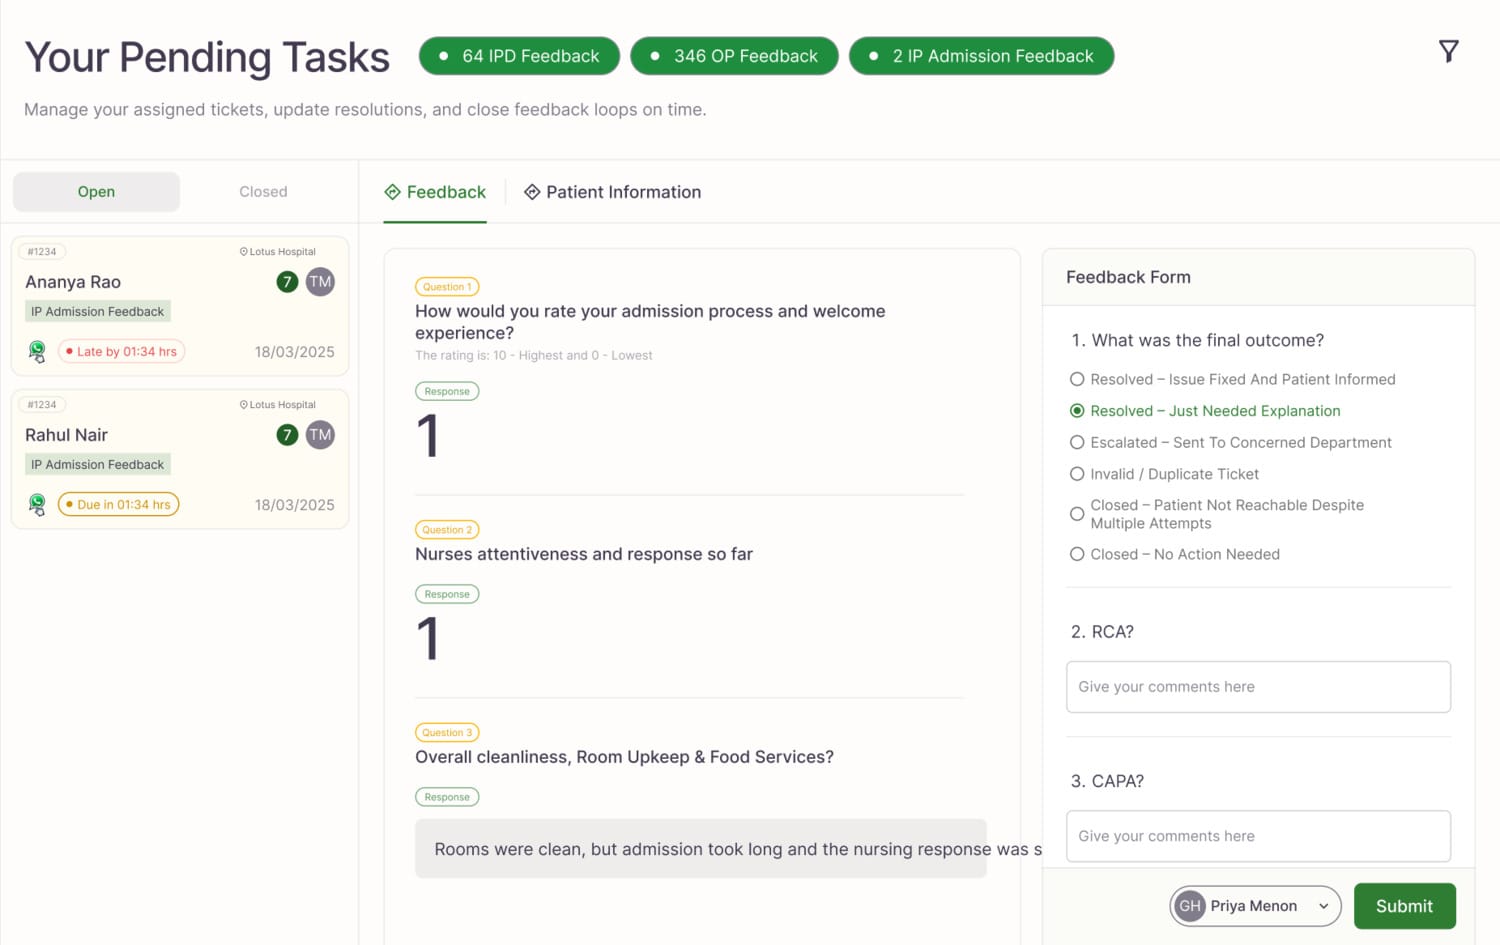
| Ticket workspace | "What do I fix next, and what's the full context?" | the complaint, its history, and the Close-the-Loop panel |
What follows is how those questions became design decisions. Each screen appears as evidence for a decision, not as a stop on a tour.
Split analytics into three surfaces, not one dashboard
The obvious move was a single powerful dashboard with everything on it. I deliberately didn't. Each question has a different owner and a different failure mode, and mixing them creates a specific danger: a leader could see a low response rate and misread it as falling satisfaction, when it actually means messages aren't being delivered. So analytics became three deliberately separate surfaces, one per question, and they sit as three tabs across the top of the live console:
Tradeoff: three surfaces mean more navigation than one. I accepted it because it protects the integrity of the decision made on each screen. Un-confusable metrics were worth one extra click.
Shape the dashboard like the hospital, not like a survey
The leadership dashboard is organised around the hospital's own structure, so a leader moves from "something is wrong" to "here is where it's wrong" in seconds. It surfaces NPS and CSAT, the OP vs IP split, and performance broken down by department, specialization, doctor and zone, alongside overall patient sentiment. The goal was a screen a leader opens every morning and acts on, not a report they read once a month.
1234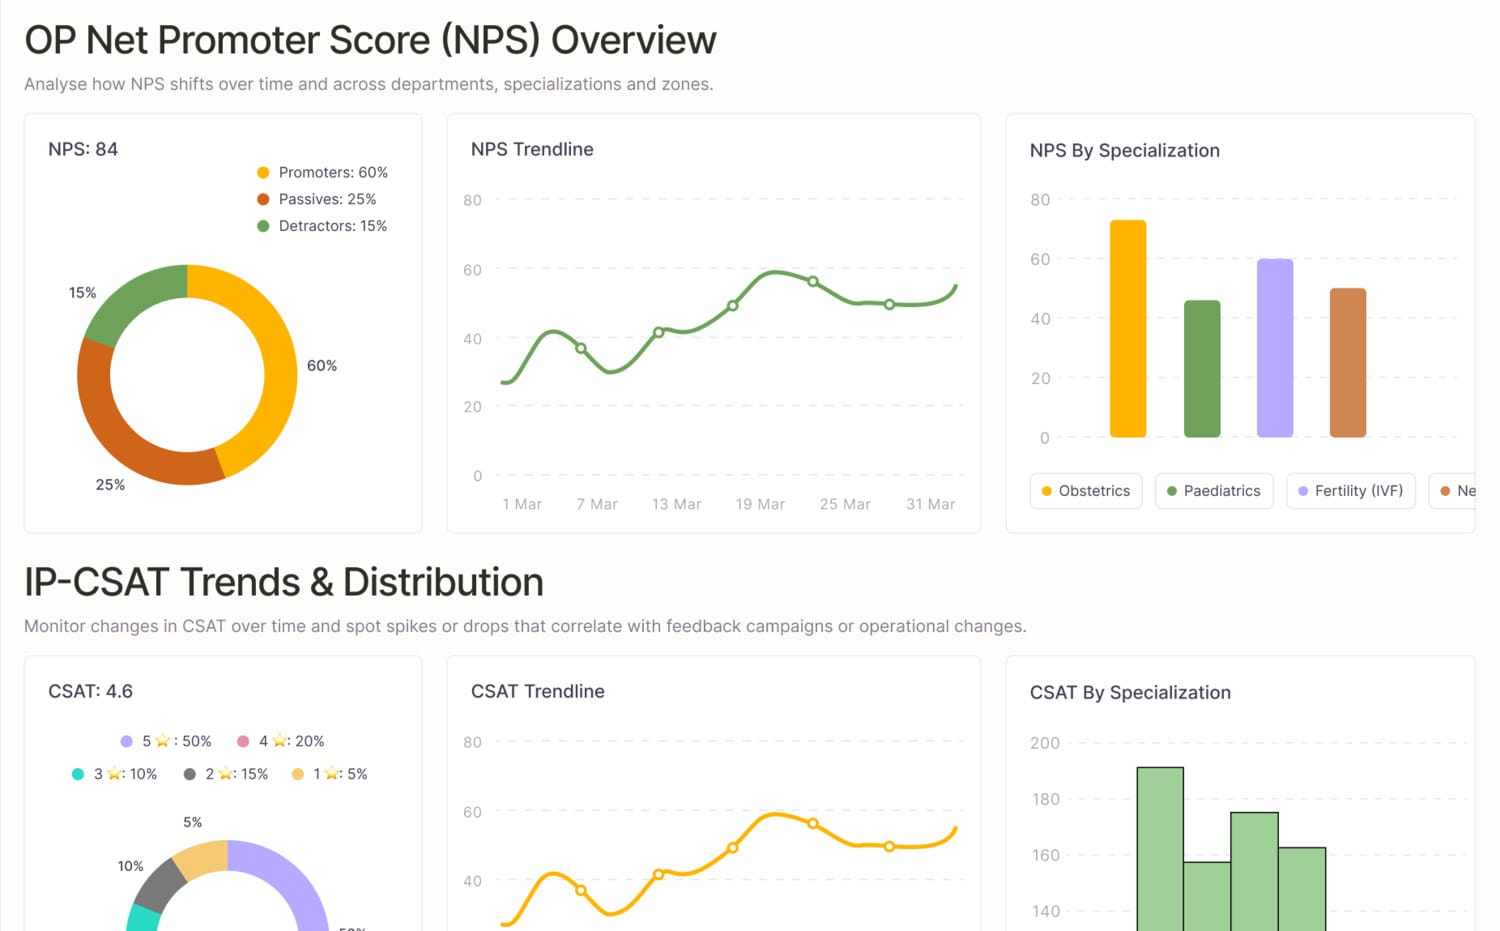
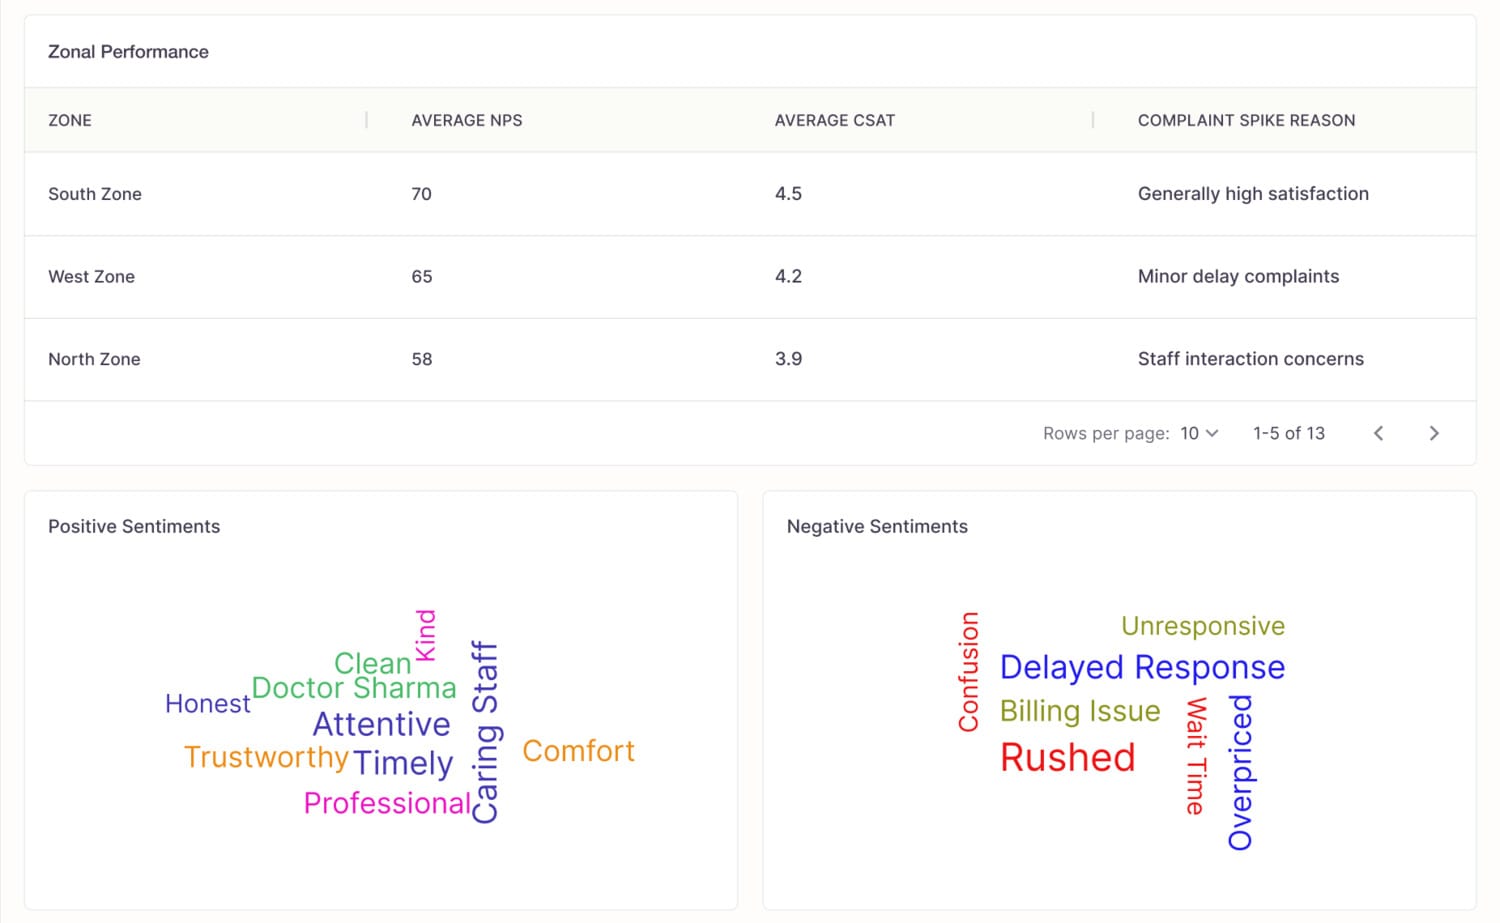
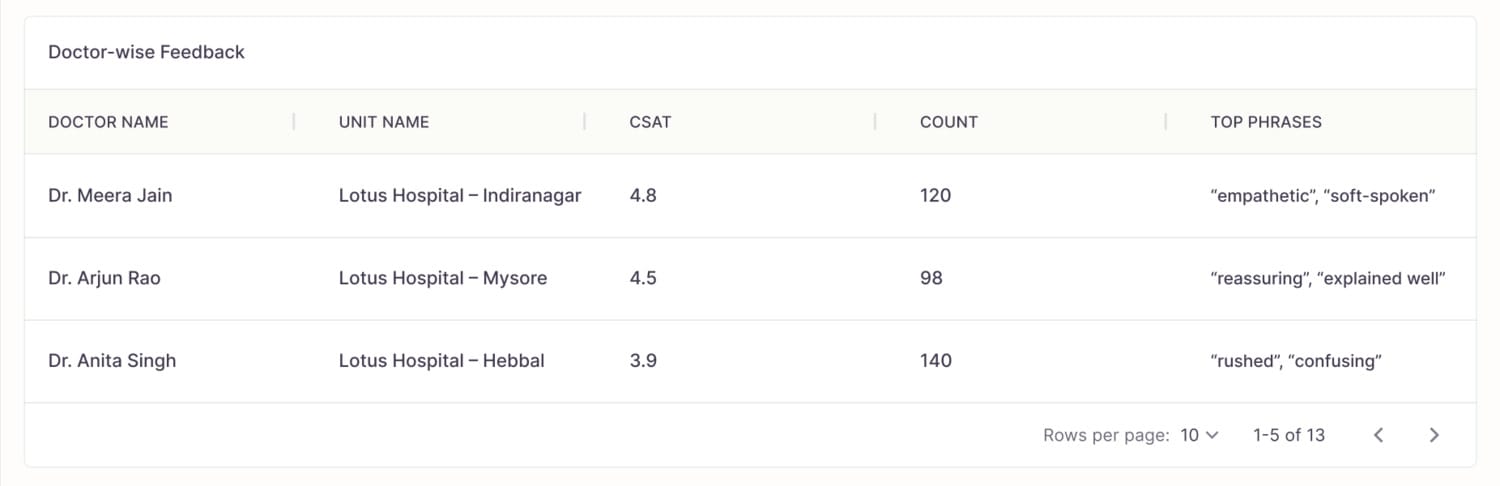
Separate the collection pipeline from the experience
Because every survey goes out over WhatsApp, the health of collection is its own question. It gets its own tab, Feedback Analytics, so a low number is read correctly and never mistaken for falling satisfaction.
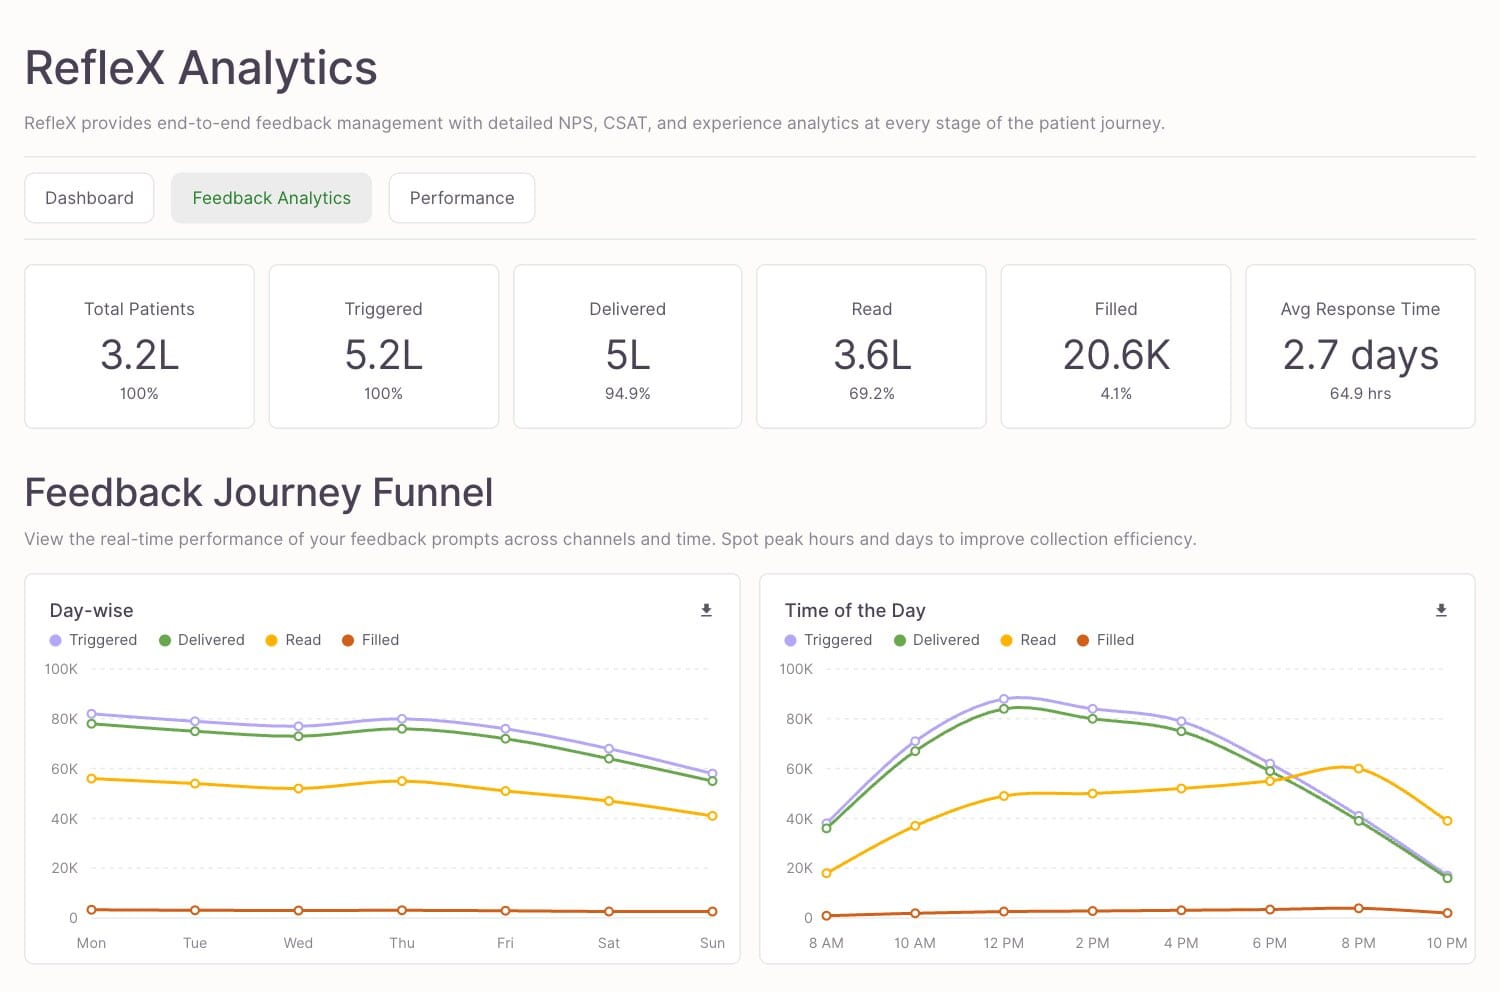 1234
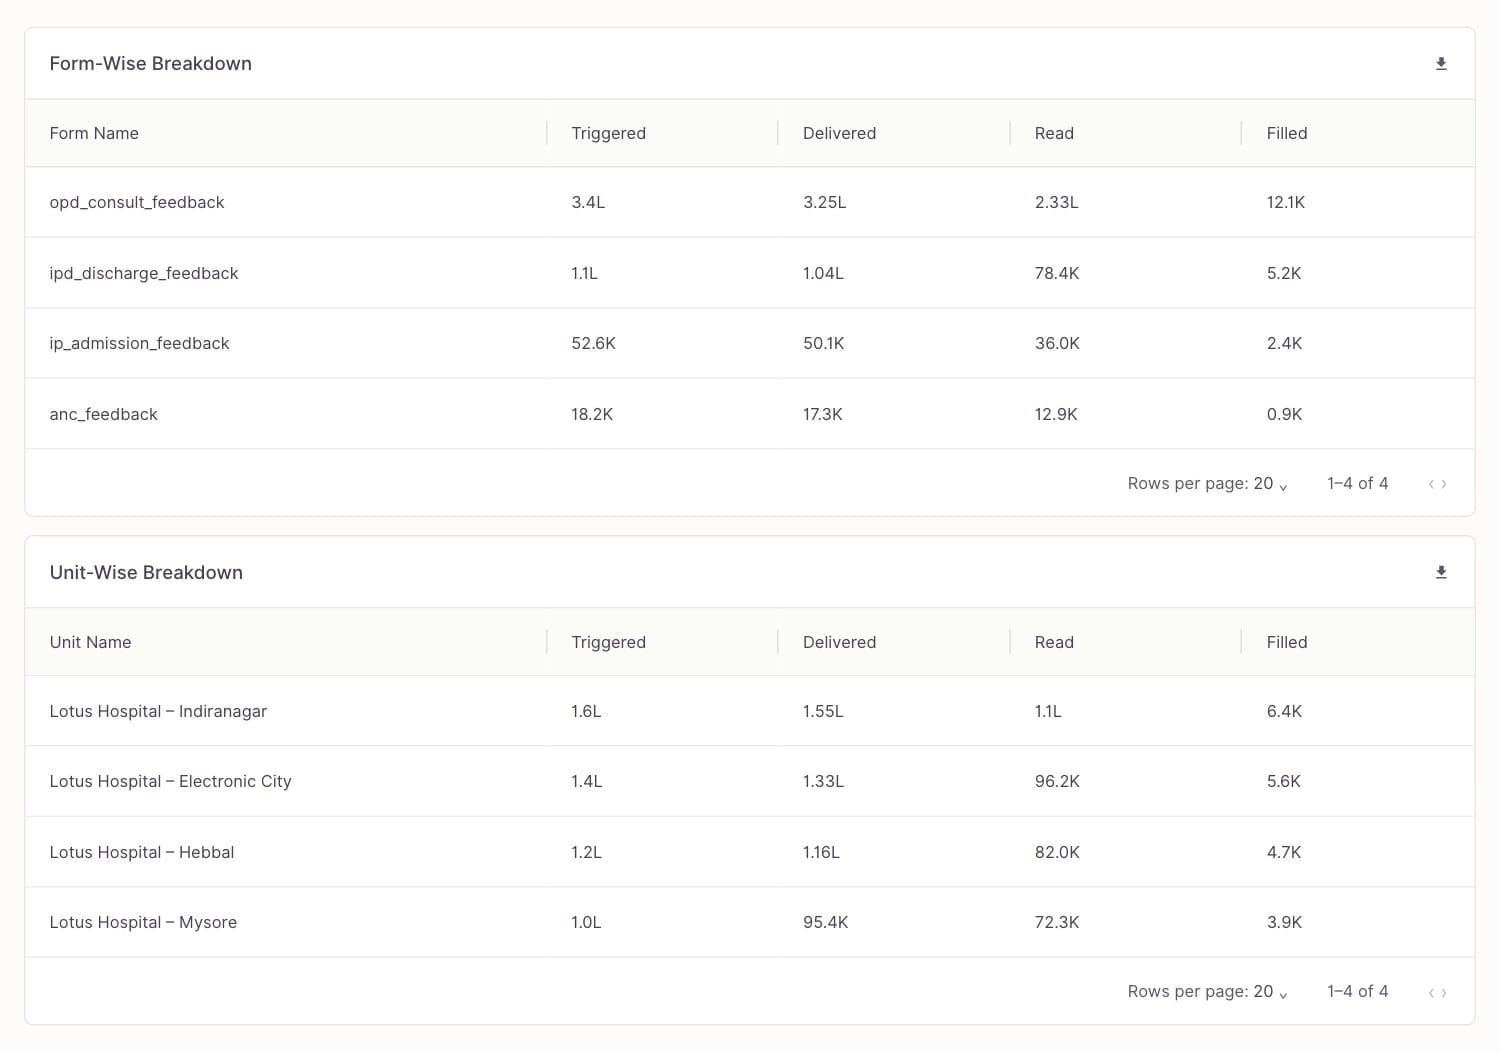
Meet patients in their own language
A survey in the wrong language is really just another non-response, so the WhatsApp form asks the patient to pick their language first. On the fertility chain, nine are live: about two-thirds answer in English, roughly one in seven in Hindi, and the rest spread across seven more.
Make negative feedback create work automatically
The heart of Reflex: no coordinator has to read a report and decide to act. The act of complaining is the act of creating accountable work.
Tickets are routed by what the complaint is about:
A deadline on every ticket, then an automatic climb
Routing to an owner means nothing if the ticket can quietly sit there. So it can't:
| The department that owns a ticket | Deadline before it escalates |
|---|---|
| Customer experience (CX) | 24 hours |
| Medical operations (MedOps) | 48 hours |
| Nursing | 24 hours |
| Non-medical operations (NonMedOps) | 24 hours |
The ladder is a safety net, not the main path, and how heavily a programme leans on it varies widely:
| How tickets resolved | Fertility chain | Maternity chain |
|---|---|---|
| Closed before any escalation | 74.9% | 35.6% |
| Needed at least one escalation | 25.1% | 64.4% |
At the fertility chain about one ticket in ten ever reached the top of the chain; at the busier maternity programme nearly one in three did.
One patient, many problems, many tickets
The most consequential decision, and the least obvious. The intuitive design is one ticket listing every issue. I chose the opposite: one patient with three complaints gets three independent tickets.
One shared ticket has no clear owner and can't be worked in parallel. Separate tickets give each team clear ownership, get fixed at the same time, and keep each team's SLA honest.
Tradeoff: more tickets to manage. I mitigated it with a consolidated repository (below), and because each ticket is smaller and single-owner, per-ticket effort drops even as the count rises.
A triage-first workspace that kills context switching
For the people who resolve issues, the enemy is context switching: the complaint in one place, the history in another, the fix in a third. The ticket workspace puts all of it on one screen.
1234Make "closed" mean "learned"
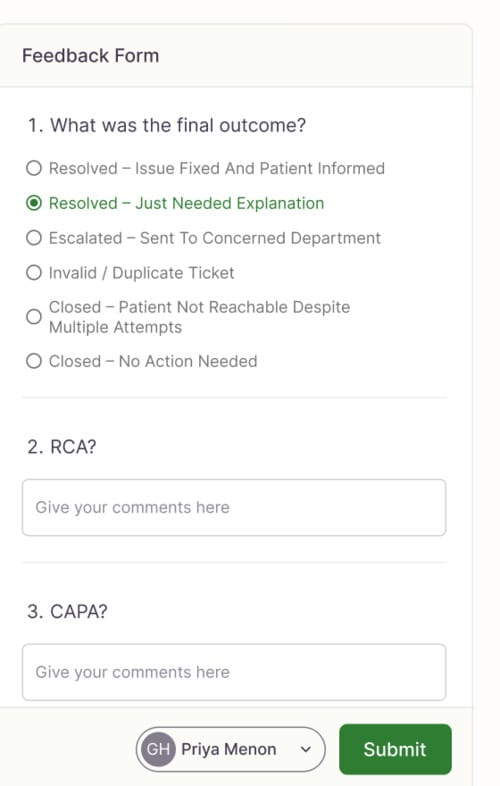
Marking a ticket "Closed" teaches the organisation nothing. The Close the Loop panel requires a real record for every resolution:
 123
Every resolved ticket becomes a standardized audit trail and, over time, institutional memory the hospital can mine to stop recurring failures. It reframes closure from an administrative act into a learning one.
Because every completed response is filed as a ticket, many close quietly: a good visit that only needed acknowledging. But across the 19,000+ closures that carry a completed form, the record shows the full range of what "resolved" actually meant:
| What the resolution was | Share of documented closures |
|---|---|
| Reviewed, no action needed | 46% |
| Explanation given to the patient | 18% |
| Issue fixed | 12% |
| Invalid or duplicate | 9% |
| Patient could not be reached | 8% |
| Escalated to a department | 7% |
Give leadership one consolidated source of truth
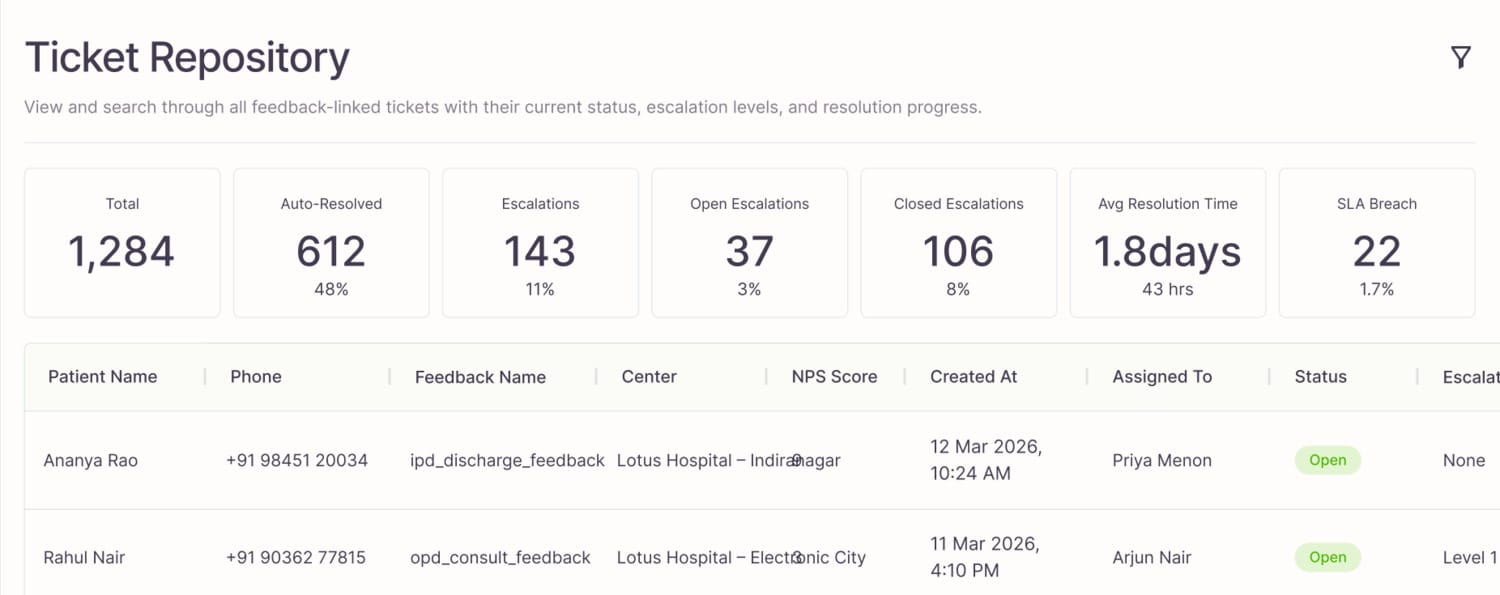
Individual tickets are for resolvers. Leadership needs the whole board. The Ticket Repository is a searchable, filterable, exportable table spanning patient, feedback, centre, NPS, assigned owner, status, escalation level, created date and resolution, tuned for weekly operational reviews. It also surfaces the numbers that matter at a glance: total, auto-resolved, escalations, average resolution time and SLA breaches.
Prove the pipeline before you trust the numbers
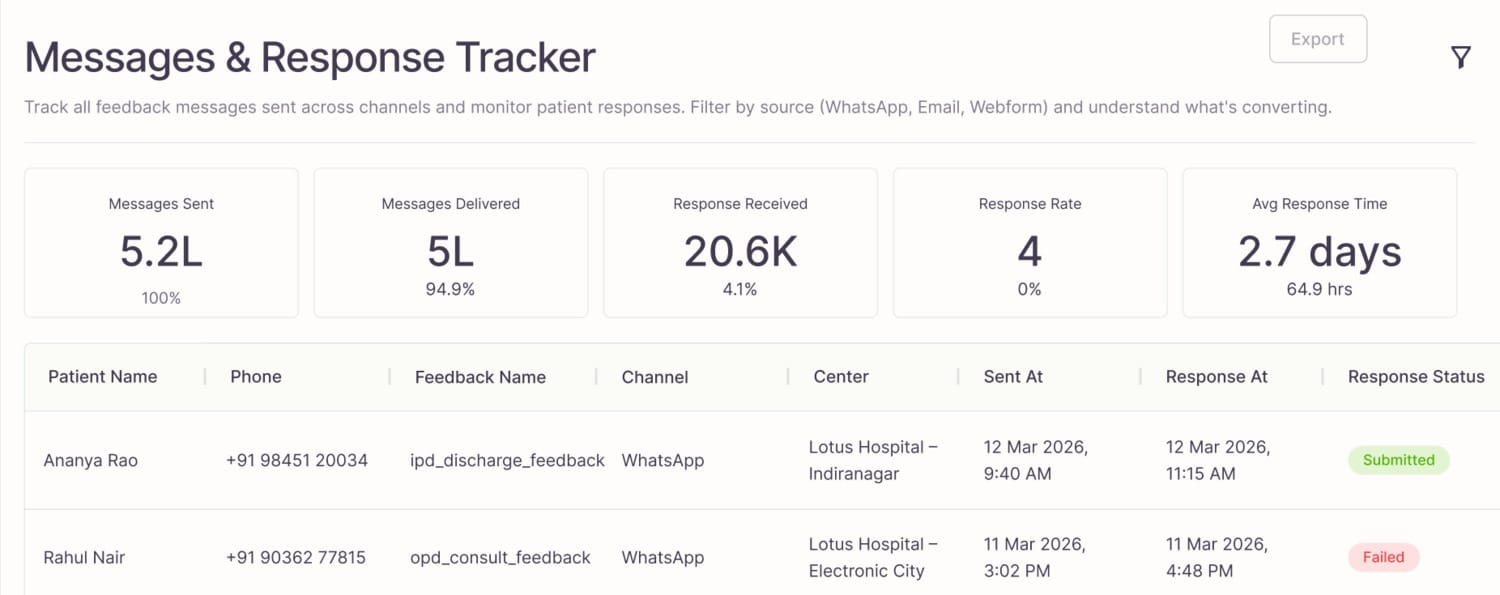
Patient-experience data is only credible if delivery is. The Message & Response Tracker monitors the entire WhatsApp pipeline: messages sent, delivered, responses received, response rate and average response time. Its most important job is to let a hospital tell these two situations apart:
"Patients didn't respond." vs. "Patients never received the survey."
Those look identical in the raw numbers and demand completely different fixes. Separating them is what earns leadership's trust back.
 123
Establish tenant context before anything else
Because Reflex is multi-tenant, every hospital enters through its own dedicated tenant domain. The login is deliberately minimal, and its real job isn't authentication, it's context: it guarantees an administrator is inside the correct organisation before they act, which in a multi-hospital system is a safety feature, not a nicety.
Tradeoffs, in one place
Three analytics surfaces, not one. Cost: more navigation.
Why it was worth it Every decision is made on data that can't be confused.
Many small tickets, not one big one. Cost: more tickets.
Why it was worth it Clear owners, fixes in parallel, honest SLAs.
Structured closure, not one-click "Closed". Cost: a few seconds per ticket.
Why it was worth it The hospital learns, and failures stop recurring.
Automatic routing, not manual triage. Cost: rules need edge cases.
Why it was worth it Near-zero triage time and instant ownership.
Reflection
Looking back, this project was never really about redesigning a hospital feedback platform. It was about redesigning how a hospital responds to its patients.
The most valuable thing I did wasn't a screen. It was reframing the brief, from "make the dashboard nicer" to "make feedback impossible to ignore," and holding the product to that idea through every decision: automatic tickets, unambiguous ownership, structured closure, pipeline trust, and an information architecture honest about the fact that outpatients and inpatients live different journeys.
As LeapHealth's founding designer I had already built the company's design system and language from scratch. Reflex is where that foundation got tested: I defined this product end to end, from understanding hospital operations and shaping the IA to designing the interfaces that serve leadership, experience teams and frontline staff. It now runs as the live feedback operation at the hospitals that adopted it, which is the part I am proudest of: the reframing survived contact with real wards, real tickets and real deadlines.
Thanks for reading.